One of the coolest features in Excel is Pivot Tables. You probably use them frequently, because of their ease of use, flexibility, and incredible speed.
Still a lot of its powers remains hidden.
I'm going to talk about 'grouping' in this post, as I notice it is hardly used.
Let's start with a basic data set:

A simple pivot table turns it into something more useful:
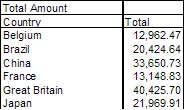
What do we need to do some grouping? Only the Group an Ungroup hidden inside the PivotTable menu (on the Pivot-toolbar), or in the Data-menu:

I'm going to show you 3 ways of using this grouping.
1) Grouping Items
First select all items belonging together (use the control key to select multiple cells):
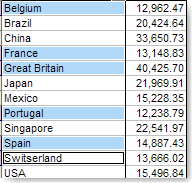
Select the 'Group' menuitem:
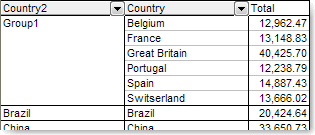
Notice an extra column has been added at the front, called Country2,
and 'Group1' is defined for the previously selected countries.
Change the column title to something else (just click on it and start typing),
and do the same for the Group1 name.
Then select the remaining countries, group them and give them a name too:
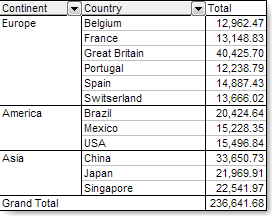
'Continent' is a column that does not exist in your original source data,
and yet you can threat is like any other column as of now.
Try double-clicking e.g. Europe. The whole section will collapse.
Double-clicking it again, and it will expand.
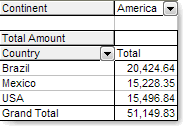
This also means you can drag it e.g. to the page fields section of the pivot table, to do filtering:
2)
Grouping Dates First change the pivot table to have the dates in the first column:
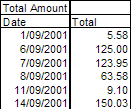
Select 1 of the dates, and choose the 'Group' menuitem again. This time a dialogbox shows up:
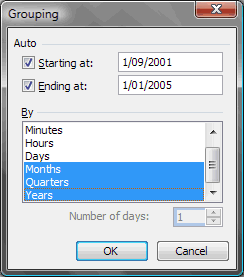
Select Months, Quarters and Years, and click OK:
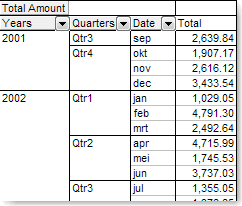
Excel automatically created 3 extra columns, and again they are now part of your data set,
and can be used the way you like. e.g.:
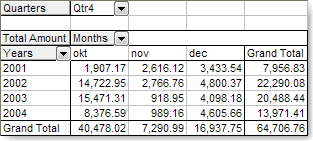
(I did rename 'Date' to 'Months')
3)
Grouping Numbers This last grouping is one I discovered by accident years ago, and I've used it many times since.
Put the 'Amount' field in the first column (yes indeed, the 'Amount' field):
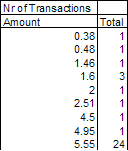
(I put the 'Count of Code' in the Data area, and changed the name to 'Nr of Transactions')
Now let' group the first column. Just click one of the Amount values and 'Group':
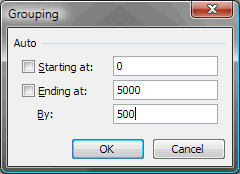
(I changed the proposed values, and turned them into more meaningful values).
This is the result:
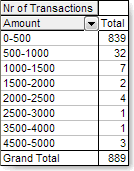
Isn't this amazing?
You can immediately see how many transaction you did for certain amount-groups.
As you can see, there is remarkable power hidden in Pivot Tables. Use it !
Category: Microsoft Excel |  Technorati: Microsoft, Excel
Comments (1)
 Technorati: Microsoft, Excel


I can only confirm that Groupings are indeed a very powerful feature in optimizing use of pivot tables. Very nicely explained by Theo. Thanks.